WinSTAT Download, Features, Setup, and Alternatives
Contents
Ever stared at a spreadsheet of survey results and thought, “I need real statistics, not just averages”? Most people then face an ugly choice: learn a complicated program or bend Excel formulas until they break.
WinSTAT offers a third path. This guide covers the WinSTAT download, its features, installation, troubleshooting, pricing, and alternatives, so you can decide fast whether it fits your work.
WinSTAT is a statistics add-in for Microsoft Excel on Windows. It adds regression, ANOVA, nonparametric tests, survival analysis, and charts to Excel’s Add-Ins tab. The developer offers a 30-day demo and a $99 license.
What Is WinSTAT and What Does It Do?
WinSTAT is a paid statistics add-in for Microsoft Excel, made by R. Fitch Software. It runs statistical tests on data already sitting in your worksheet.
WinSTAT Statistics Software Overview
Think of it as a statistics toolbox bolted onto Excel. You keep your familiar grid, then pick a test from a menu instead of writing code.
The pitch is simplicity. You do not need to be a full-time statistician to run a t-test or a regression.
How WinSTAT Works Inside Excel
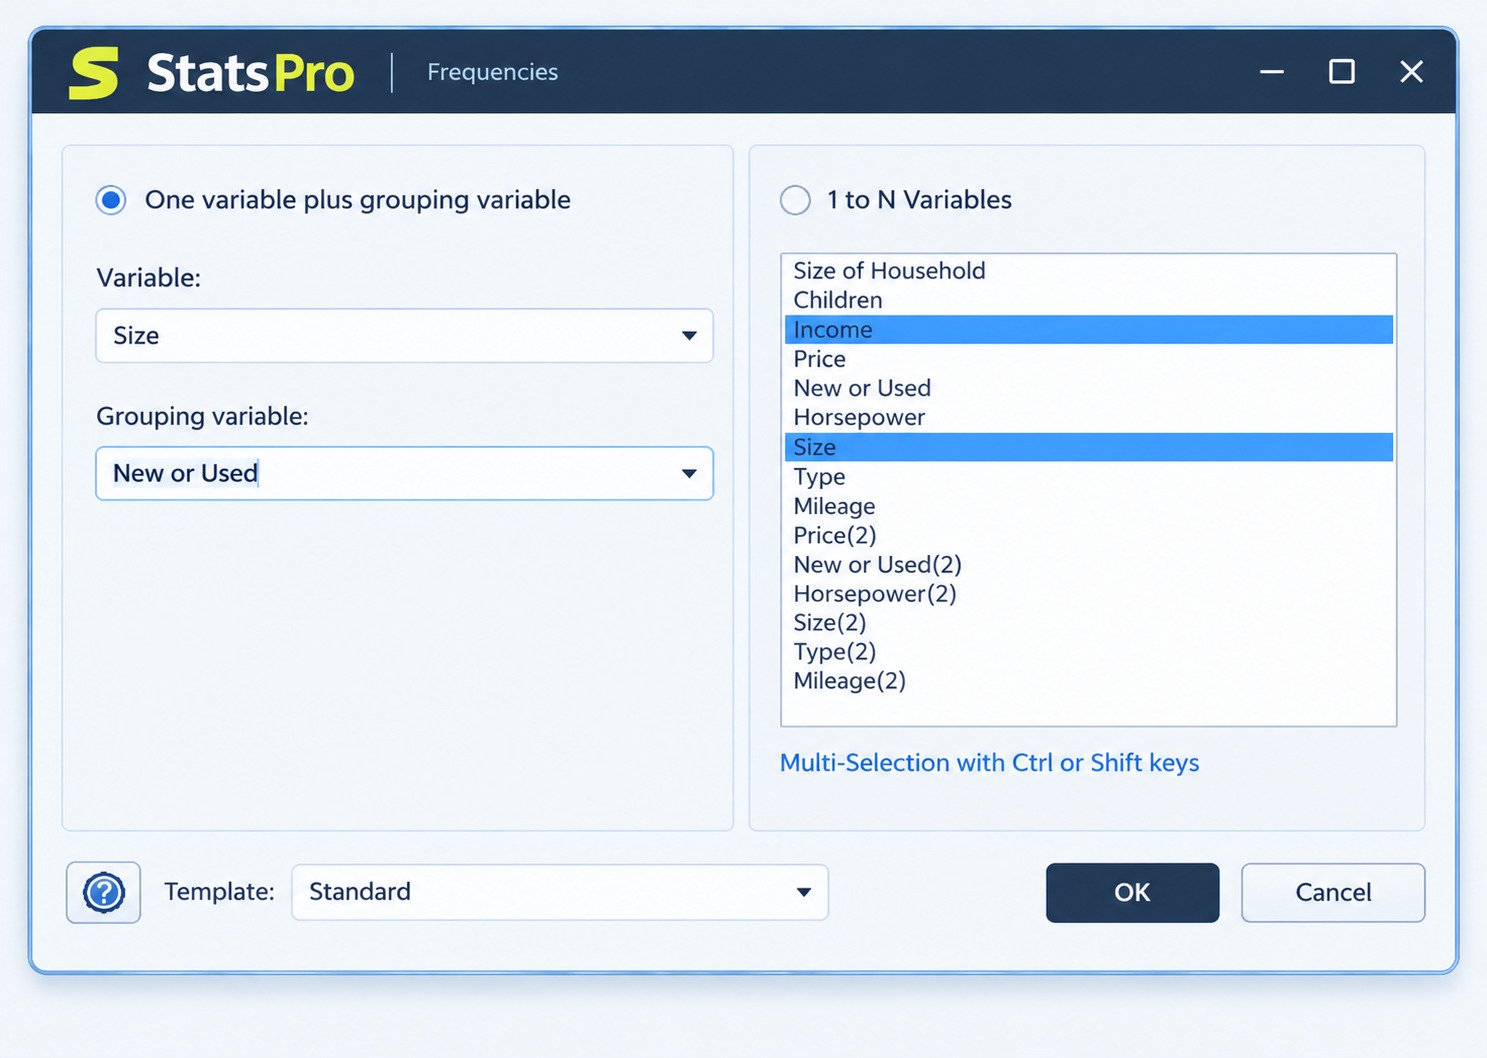
You type or import data the normal Excel way. Then you choose a function from the WinSTAT toolbar, select your variables in a dialog, and click run.
Results come back as ordinary Excel tables and charts. That means you can format, copy, or recalculate them like any other worksheet content.
Who Can Use WinSTAT for Data Analysis?
It suits people who already live in Excel and need more than the built-in functions:
- Students working on thesis or lab data
- Clinical and biomedical researchers
- Quality engineers and lab technicians
- Small business analysts
- Teachers who demonstrate statistics in class
What Types of Statistical Analysis Can WinSTAT Perform?
Mostly classical, frequentist statistics: comparing groups, measuring relationships, predicting outcomes, and checking data quality. It also reaches into survival and multivariate territory.
It is not built for machine learning, big data, or advanced mixed-effects modeling. Knowing that upfront saves frustration.
WinSTAT Features and Statistical Analysis Tools
The developer’s function list is broad for a $99 tool. The table groups what it lists.
| Category | Tests and tools listed |
|---|---|
| Descriptive | Descriptive statistics, frequencies, means |
| Group comparison | Independent and dependent t-tests, ANOVA, repeated measures |
| Nonparametric | Mann-Whitney U, Wilcoxon, Kruskal-Wallis, Friedman, Cochran Q, McNemar |
| Correlation | Pearson, Spearman, Kendall’s tau, partial, cross-correlation |
| Regression | Simple, multiple, polynomial |
| Multivariate | Discriminant, cluster, factor analysis |
| Survival | Kaplan-Meier, Cox regression |
| Data checks | Randomness, outliers, normal distribution |
| Categorical | Chi-square, crosstabs |
| Quality | Process capability |
| Charts | Histogram, means, box and whiskers |
Descriptive Statistics and Frequencies
Every analysis starts here. Descriptive statistics summarize your data with the mean, median, spread, and range, while frequencies count how often each value appears.
Run these first. They reveal typos, impossible values, and lopsided distributions before they distort a bigger test.
Regression Analysis With WinSTAT
Regression predicts one variable from others. WinSTAT covers simple, multiple, and polynomial versions, which handles most everyday prediction questions.
A typical example: predicting monthly sales from ad spend and season.
ANOVA and Repeated Measures Analysis
ANOVA compares averages across three or more groups. The repeated measures option fits designs where the same people are measured several times, such as before, during, and after a treatment.
Survival Analysis and Cox Regression
This is where WinSTAT stands out among budget add-ins. It lists Kaplan-Meier curves and Cox regression for time-to-event data, common in medical and reliability studies.
Statistical Charts, Tables, and Graphs
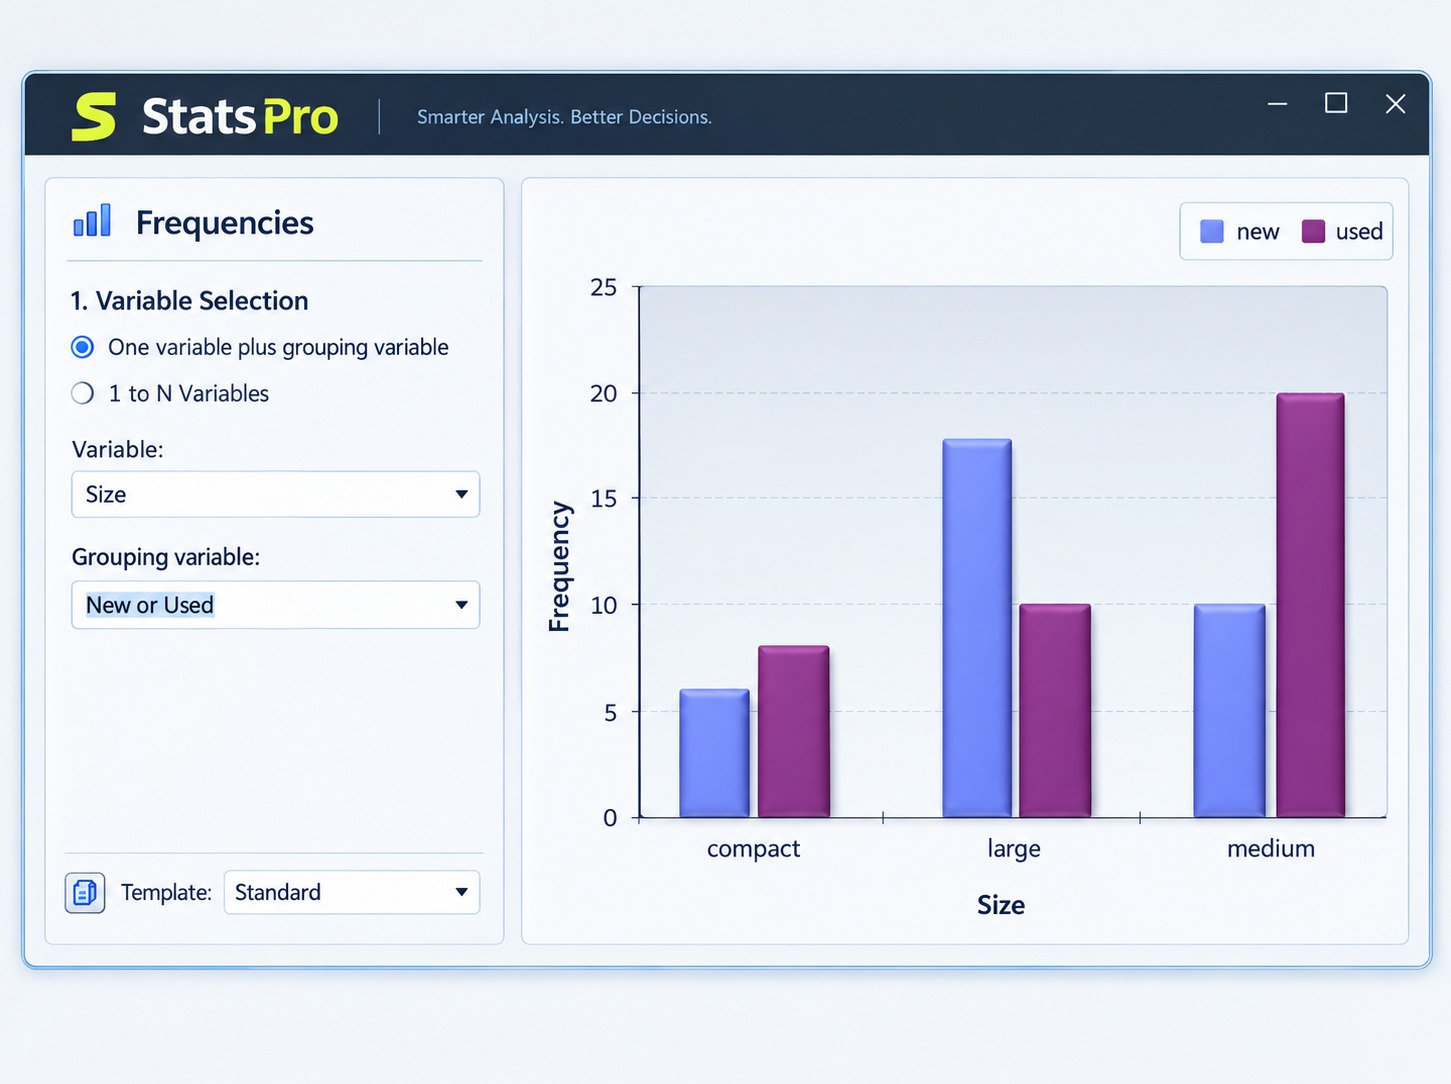
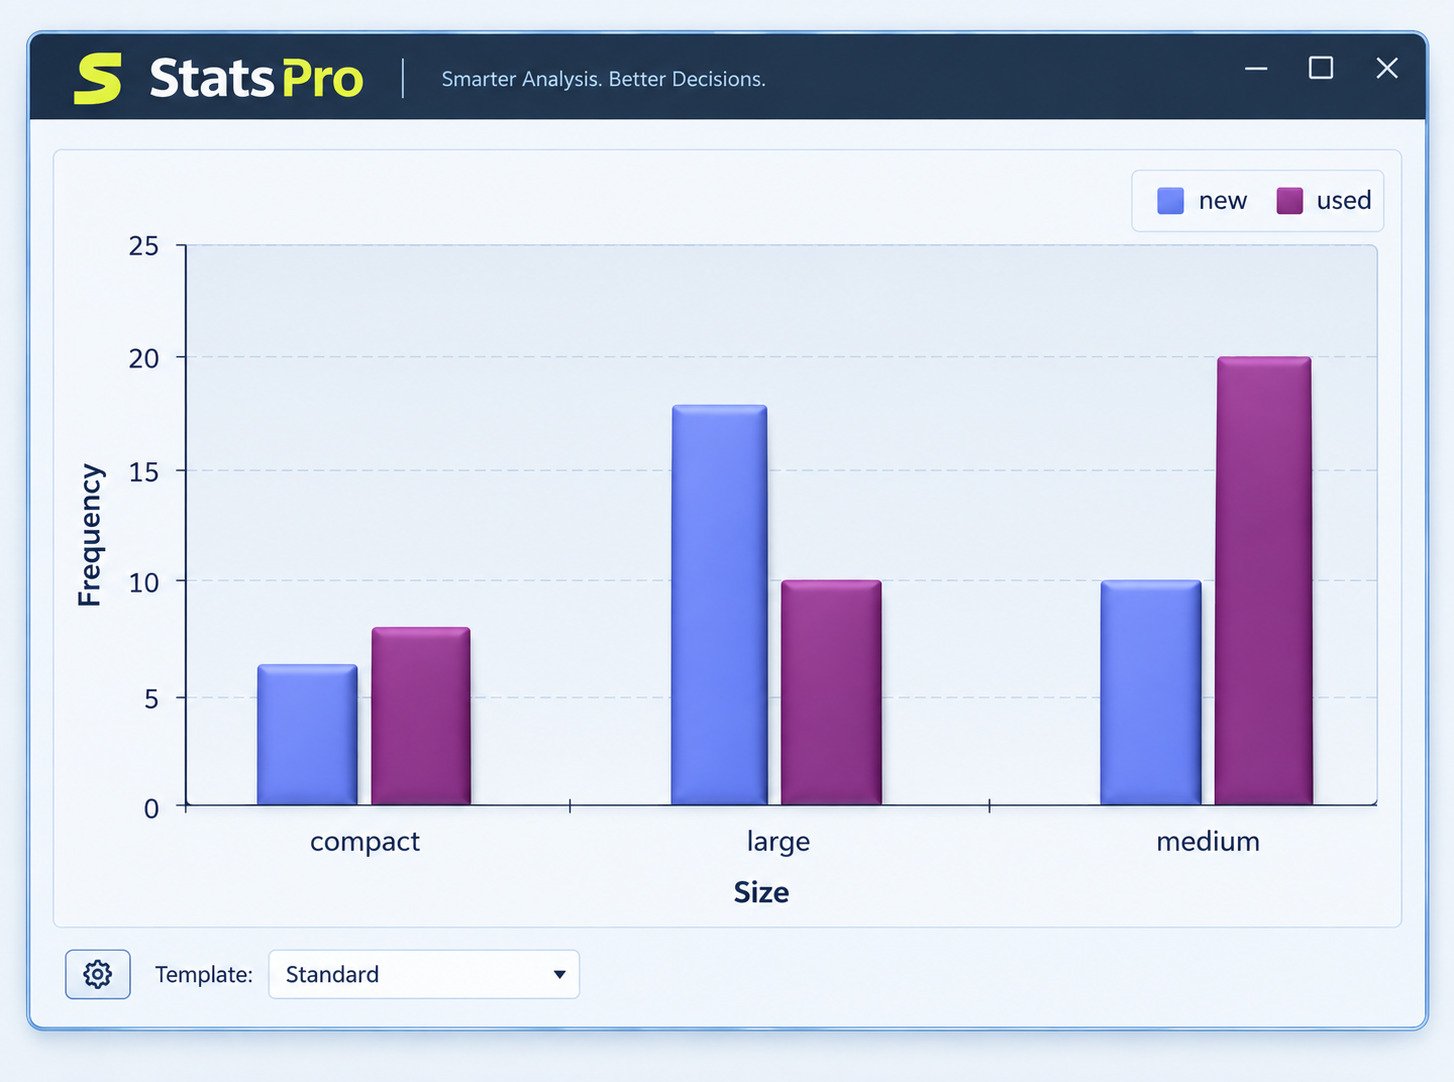
Every analysis can produce a formatted table, and many produce a chart. Because they are Excel objects, you can resize, recolor, and relabel them without leaving the program.
Crosstabs, Chi-Square, and Fisher’s Exact Tests
WinSTAT lists crosstabs, chi-square, and McNemar tests. I could not find Fisher’s exact test on the function list, so confirm it in the demo if you need it for small samples.
WinSTAT and Microsoft Excel: How the Add-In Works
WinSTAT installs itself into Excel and appears under the Add-Ins tab. Every result lands back in a worksheet.
Enter and Prepare Data Directly in Excel
No special import wizard is needed. Type values, paste them, or use Excel’s own import tools for CSV and database files.
Keep one variable per column and one case per row. Clean layouts prevent most dialog errors later.
Generate Tables and Charts in Excel
Output arrives as native Excel tables and graphics. According to the reseller’s product page, you can also save templates for charts and tables, so repeat reports keep the same look.
Customize Statistical Results With Excel
Since results are worksheet content, Excel’s formatting tools apply. Change fonts, round decimals, or highlight significant p-values with conditional formatting.
That flexibility is a quiet advantage over programs that lock output into a fixed viewer.
Export and Integrate Results Into Reports
The same source says results can be copied to Word or PowerPoint, including through dynamic linking. In practice, that helps when a monthly report needs fresh numbers without retyping.
WinSTAT Download and Latest Version
You download WinSTAT from the developer’s site as a demo, then unlock it with a serial number after purchase.
WinSTAT Download for Windows
The official download page tells you to click the link, choose “Run,” and follow the installer steps. Only download from the developer’s own site when possible.
WinSTAT Free Demo Download
The demo is fully functional but time-limited to 30 days after first installation. Downloading again or reinstalling will not extend it, so plan your test period.
WinSTAT Latest Version
The developer’s pages show no version number or release notes. That is common for small niche tools, but it means you should judge the software by the demo, not by version claims.
WinSTAT 9.01 and Version Information
The software library FreeDownloadManager lists version 9.01, a 7.2 MB installer, and R. Fitch Software as developer. That is a third-party listing, and I found no official changelog, so verify the current build on the developer’s site.
WinSTAT Download Requirements for Microsoft Excel
| Requirement | Detail |
|---|---|
| Excel version | 2007 or newer (older versions have a separate page) |
| Excel bitness | 32-bit or 64-bit |
| Operating system | Windows |
| Delivery | Download only, serial number by email |
How to Install and Set Up WinSTAT
WinSTAT Installation on Windows
- Close Excel completely.
- Download the demo installer from the developer’s page.
- Run it and follow every screen.
- Restart your PC if prompted.
WinSTAT Setup and Configuration
There is little to configure. The installer places the toolbar, and the help file arrives with the download.
Read the help file once before your first analysis. It explains each dialog and the assumptions behind each test.
Enable the WinSTAT Add-In in Excel
After installation, open Excel. According to the developer, the WinSTAT toolbar appears automatically under the Add-Ins tab.
If nothing shows up, jump to the troubleshooting section below.
How to Check Whether WinSTAT Was Installed Correctly
Run a quick test. Type ten numbers in a column, select them, and ask for descriptive statistics.
If a results table appears in a new area, the install works.
WinSTAT License Activation and Serial Number
After payment, you receive an email with a serial number that converts the demo into the licensed product. Save that email somewhere safe, because you will need it again if you ever reinstall Windows or switch computers later.
How to Use WinSTAT for Statistical Analysis
Enter data, choose a test from the Add-Ins menu, assign variables, run it, then read the output table.
Import or Enter Data for Statistical Analysis
Put each variable in its own column with a clear header. Excel’s import tools handle CSV files, text files, and database connections.
Watch for numbers stored as text. They look fine but break calculations, so convert them first.
Choose a Statistical Test in WinSTAT
Start from your question, not the menu. Comparing two groups? Try a t-test. Looking for a link between two measurements? Try correlation.
Not sure which fits? The NIST Engineering Statistics Handbook is a trusted, free reference for matching tests to data.
Configure Analysis Options and Variables
Each dialog asks which columns to use and which options to apply. Select your ranges carefully, including or excluding headers as the dialog expects.
A single wrong range is the most common reason results look strange.
Run an Analysis and Interpret the Results
Look at the p-value first, then the effect size or coefficient. A tiny p-value with a trivial effect rarely matters in real life.
Also check assumptions such as normality before trusting a parametric test.
A Quick Worked Example
Imagine two classes took the same exam. Column A holds the class label, and column B holds each student’s score.
Run descriptive statistics first to spot odd values. Then check normality, and choose an independent t-test if scores look reasonable. If the p-value falls below 0.05, the class averages differ by more than chance alone would usually explain.
Save, Customize, and Reuse Statistical Reports
Because output lives in Excel, you can save the whole workbook. Reuse it by pasting new data and rerunning the analysis.
Habits That Prevent Bad Results
- Keep a raw-data copy on a separate sheet.
- Label every column clearly.
- Check for blanks and typos before running tests.
- Write down which test you chose and why.
- Save the workbook before each big analysis.
These habits take two minutes and prevent hours of confusion. Good statistics start with a clear question, clean data, and honest interpretation; the software only speeds up the arithmetic.
WinSTAT Regression, Correlation, and Predictive Analysis
Perform Linear Regression in WinSTAT
Pick your outcome variable, add predictors, and run. Read three things: the R-squared, the coefficients, and the significance of each predictor.
Multiple and Polynomial Regression
Multiple regression uses several predictors at once, such as price, advertising, and season. Polynomial regression fits curves, which suits data that bends instead of following a straight line.
Avoid stacking too many predictors on a small sample. A rough guide is at least ten observations per predictor.
Pearson, Spearman, and Partial Correlation
Use Pearson for straight-line relationships in roughly normal data. Choose Spearman or Kendall’s tau for ranked or skewed data.
Partial correlation removes the influence of a third variable, which helps avoid false links.
| Situation | Suggested method |
|---|---|
| Two continuous, normal variables | Pearson |
| Skewed or ranked data | Spearman or Kendall |
| Control for a third variable | Partial correlation |
Interpret Regression and Correlation Results
A strong correlation does not prove one thing causes another. Ice cream sales and sunburn both rise in summer, yet neither causes the other.
Check residuals or a scatterplot too. A good R-squared can hide a curved pattern.
WinSTAT ANOVA and Statistical Hypothesis Tests
Perform One-Way and Other ANOVA Analyses
Place your outcome in one column and group labels in another. Run ANOVA, then read the F statistic and its p-value.
A significant result only says that some groups differ. Follow up to find which ones.
Independent and Dependent t-Tests
Use an independent t-test for two separate groups, such as control versus treatment. Use a dependent t-test for paired measurements, such as the same patient before and after.
Mann-Whitney and Wilcoxon Tests
These are the nonparametric partners. Mann-Whitney replaces the independent t-test, and Wilcoxon replaces the paired one when normality fails.
Kruskal-Wallis and Other Nonparametric Tests
Kruskal-Wallis stands in for one-way ANOVA on ranked data. Friedman handles repeated measures without normality.
Choose the Appropriate Statistical Test
| Goal | Normal data | Non-normal data |
|---|---|---|
| Two independent groups | Independent t-test | Mann-Whitney |
| Two paired groups | Dependent t-test | Wilcoxon |
| Three or more groups | ANOVA | Kruskal-Wallis |
| Repeated measures | Repeated measures ANOVA | Friedman |
WinSTAT Survival, Classification, and Multivariate Analysis
Kaplan-Meier Survival Analysis
Kaplan-Meier estimates how long subjects last before an event. Think patient survival, machine failure, or customer churn.
Cox Regression Analysis
Cox regression adds predictors to survival data. It answers questions like whether age or treatment changes the risk of failure.
Discriminant, Cluster, and Factor Analysis
Discriminant analysis classifies cases into groups. Cluster analysis finds natural groupings. Factor analysis reduces many variables to a few underlying ones.
Multivariate Statistical Analysis in Excel
Multivariate tools often feel intimidating. Running them from a dialog lowers the barrier, though you still need enough cases. As a rule of thumb, aim for many more rows than variables.
WinSTAT Statistical Tables, Charts, and Reporting
Create Histograms, Scatterplots, and Box Plots
The listed charts include histograms, means plots, and box and whiskers. Use histograms to check shape, and box plots to spot outliers at a glance.
Generate Statistical Tables in Excel
Tables include counts, means, standard deviations, and test statistics. They are ready to paste into a manuscript after light formatting.
Use Excel Templates for Repeated Reports
Save your chart and table templates once. Next month, drop in new data and keep the same layout, which saves real time on recurring reports.
Move WinSTAT Results Into Word and PowerPoint
Copy a table or chart straight into your document. If dynamic linking is enabled, updating the workbook refreshes the report.
WinSTAT Statistical Tests for Data Quality and Distribution
Test for Normal Distribution
WinSTAT lists a normal distribution test. The public function list does not name the method, so check the help file to see whether it uses Shapiro-Wilk or Kolmogorov-Smirnov.
Identify Statistical Outliers and Test Randomness
Outlier and randomness tests are listed too. Run them before modeling, because one extreme value can quietly wreck a regression.
WinSTAT for Quality Control and Process Analysis
The function list includes process capability analysis, which shows whether a process stays inside its specification limits. I did not find control charts or Pareto diagrams listed, so treat those as unconfirmed.
Process capability indexes such as Cp and Cpk compare how much your process varies with how much the customer allows. A low value means too many parts risk falling outside specification.
If quality work is your main goal, compare it against a dedicated SPC package before buying.
WinSTAT Troubleshooting and Common Problems
WinSTAT Add-In Not Appearing in Excel
Try these steps in order:
- Open File > Options > Add-ins.
- Set Manage to COM Add-ins, click Go, and tick WinSTAT if it is listed.
- Repeat with Excel Add-ins.
- Check Disabled Items in the Manage list and re-enable it.
- Reinstall as administrator.
Why Testing the Demo on Real Data Matters
Sample datasets always behave nicely. Your own messy file will not.
Load a real project during the demo and watch for three things: how quickly dialogs respond, whether the output matches a hand calculation, and whether the charts look presentable enough for your audience. A quick cross-check against a known result from your textbook or another tool builds confidence.
WinSTAT Not Loading After Excel Starts
Excel disables add-ins that slow startup or crash. Re-enable it, then restart Excel.
Also right-click the installer, open Properties, and click Unblock if Windows flagged the download.
Fix WinSTAT Compatibility and Add-In Problems
Two quick checks solve many issues. First, confirm you are running Excel 2007 or newer on Windows. Second, confirm the installer matches your setup.
Also avoid opening workbooks from restricted network folders while testing. Excel can block add-in features in those locations.
WinSTAT Installation Problems
Close every Office program first. Security software sometimes blocks older installers, so pause it briefly if setup fails.
If your PC crawls on large datasets, overheating may be the culprit. Our guide to checking your CPU temp shows how to spot it.
Troubleshoot WinSTAT License and Activation Issues
Re-enter the serial number exactly as emailed. If it still fails, contact the developer’s support page with your order details.
WinSTAT Compatibility and System Requirements
WinSTAT needs Windows and Excel 2007 or newer, in 32-bit or 64-bit.
Excel and Windows Versions
The order page says it runs under any Windows operating system. It mentions nothing about Excel for Mac or Excel Online, so assume they are unsupported.
Using WinSTAT With Different Windows Versions
The developer says any Windows operating system works. If you use a very new Windows release, test the demo first rather than assuming.
32-Bit and 64-Bit Excel Support
Both are listed as supported. Still, check your Excel bitness under File > Account > About Excel if you hit errors.
Is WinSTAT Safe and Legitimate?
WinSTAT looks legitimate. It has a dedicated site, a $99 price, a refund policy page, and payments handled through an authorized retailer.
WinSTAT Developer and Software Origin
The site credits R. Fitch Software, and the order page names 2Checkout as its authorized payment retailer. A German reseller, Statcon, also lists the product, which adds a second independent point of contact.
Download WinSTAT From a Trusted Source
Use the developer’s site or its listed reseller. Avoid random mirror sites that repackage installers.
What to Check Before Installing an Excel Add-In
- Who publishes it, and is there a contact page?
- Is there a clear refund and privacy policy?
- Does the installer scan clean?
- Have you backed up important workbooks?
WinSTAT Free Demo, Pricing, and License
Is WinSTAT Free?
No. The demo is free, but continued use requires a $99 per license purchase according to the developer.
WinSTAT Demo Limitations
The demo works fully but expires after 30 days. Use that window on real data, not toy examples.
WinSTAT License and Purchase Process
Ordering is online. You pay through the retailer, receive the serial number by email, and enter it to unlock the demo you already installed.
Read the refund policy before buying, since terms can change.
Is WinSTAT Worth Considering for Excel-Based Statistics?
For $99 and no scripting, yes, if your needs match the function list. If you need mixed models or heavy machine learning, look elsewhere.
WinSTAT Review: Features, Excel Integration, and Usability
Strengths
- Low one-time price
- Runs inside Excel
- Wide test coverage
- Output as Excel tables
Limitations
- Windows only
- Limited public documentation
- Some advanced tests not listed
- Interface looks dated
Excel Integration and Workflow
The biggest strength is workflow. You never export data, run a test elsewhere, and paste results back. Everything happens in one file.
Ease of Use for Researchers and Data Analysts
Dialogs are straightforward, but you still must understand your tests. The software will happily run a wrong test if you select it.
WinSTAT Strengths and Limitations
Its strengths are price, simplicity, and Excel-native output. Its weaknesses are Windows-only support, sparse public documentation, and gaps in advanced or specialized tests.
Who should use it? Excel-based students, researchers, and analysts who want dependable classical statistics without learning code.
WinSTAT Alternatives for Statistical Analysis
| Tool | Type | Best for |
|---|---|---|
| Analyse-it | Excel add-in | Polished Excel-based analysis |
| SmartstatXL | Excel add-in | Broad tests inside Excel |
| Excel Analysis ToolPak | Built-in add-in | Basic tests, free with Excel |
| R | Open source | Unlimited flexibility |
| jamovi and JASP | Free desktop | Point-and-click statistics |
| SPSS or Minitab | Commercial | Institutional and industrial use |
Excel-Based Statistics Alternatives
Analyse-it is an established Excel add-in for Windows. Wikipedia notes it succeeded Astute, the first statistical add-in for Excel, created in 1992. SmartstatXL also advertises full Excel integration.
Free and Open-Source Alternatives to WinSTAT
R offers unmatched depth but requires code. jamovi and JASP give menu-driven analysis for free, with a spreadsheet-like feel.
Alternatives for Regression and ANOVA
The Analysis ToolPak ships with Excel and covers basic regression and ANOVA at no extra cost. It is thinner on nonparametric tests, which is where WinSTAT adds value.
Alternatives for Advanced Statistical Analysis
For mixed models, complex survey designs, or large datasets, choose R, SPSS, or Minitab. They cost more time or money, but they go much further.
How to Choose a WinSTAT Alternative
Match the tool to your workflow. Want to stay in Excel? Try an add-in. Need reproducible scripts? Choose R. Want free and visual? Try jamovi or JASP.
Frequently Asked Questions About WinSTAT
A statistics add-in for Microsoft Excel that runs regression, ANOVA, and many other tests inside your workbook.
No. A fully working demo runs for 30 days, then a $99 license is required.
Yes. The developer states it supports 32-bit and 64-bit Excel on Windows.
A third-party library lists version 9.01, so confirm the current build on the developer’s site.
Yes. It lists simple, multiple, and polynomial regression, plus ANOVA and repeated measures.
Excel may have disabled it. Check the COM Add-ins and Disabled Items lists, then reinstall as administrator.
Download the demo from the developer’s site, run the installer, then open Excel and look under the Add-Ins tab.
Final Verdict on WinSTAT
WinSTAT proves you do not need a heavy, expensive package to run solid classical statistics. If Excel is already your home base, it keeps everything in one familiar place.
Try the demo on a real project before paying. Thirty days is plenty to learn whether it saves you time, and that calm certainty is worth more than any feature list.